I’d be interested in seeing a price comparison of some specific items over the course of the last four years.
I’m well aware of the reporting and personal stories people have shared about rising inflation. Inflation is real. Price gouging is real. Climate change, environmental factors, livestock disease are real. I am not at all questioning that. However, I am curious as to how these factors have had little impact on my personal shopping experiences.
I live in a major east coast city. I buy 85% of my groceries from a local produce market. I rarely buy packaged foods or prepared items. Most of my groceries are local in-season fruits, veg, protein. I’ve been paying the same $5-$6 for a dozen eggs for nearly ten years. My grocery bill for the week is typically $80.
So, it’s been weird observing, from a distance, the conversation about inflation and how people are struggling to buy groceries.
I’d like to know if and / or how a small grocery store can maintain prices for over half a decade. Is it because the products are limited in their interactions with others - less inflation due to shipping it all over or compensating for rising prices of ingredients (milk, flour, eggs, etc). Is it because the metrics for “bills seem high” is based on grocery items I’m not purchasing. Is it based on geographic location or the store items are acquired? Is it because people are buying more at the store to take home rather than spend money out for dinner (because that certainly has increased). Is buying local actually a life hack for saving money?
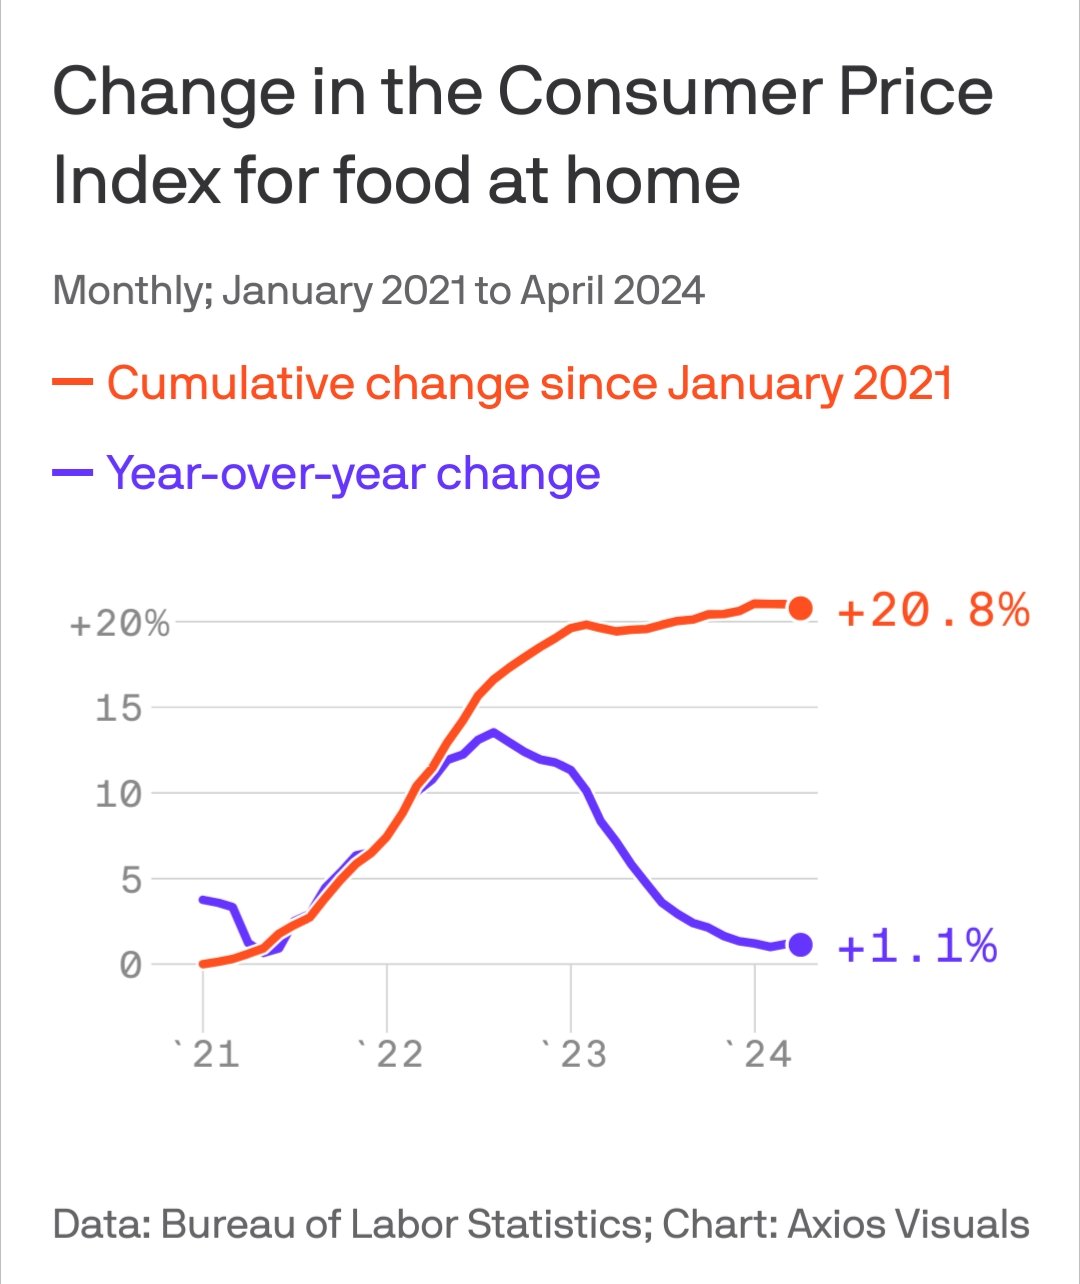
I mean, I’m reading the chart and it’s saying prices are up 21% since '21 but I am not personally seeing that. I’m curious as to why that may be. The 22% for ‘food away from home’ though, I can absolutely confirm in my experience.
I mean, I’m reading the chart and it’s saying prices are up 21% since '21 but I am not personally seeing that. I’m curious as to why that may be. The 22% for ‘food away from home’ though, I can absolutely confirm in my experience.
CPI splits Urban vs Rural, and into economic zones like East, West, and… even by State.
I’m not seeing specific items in that link. I’m thinking, for example, a 3 lb chicken, a pound of 80/20 ground beef, a pound of honey crisp apples, a head of romaine lettuce, etc.
The second link is interesting. I’m in the Philadelphia area which is one of the greater percentage increases. I’d like to know what exactly is being indexed.
The Walmart app provides historical receipt data if you have an associated card. A few months ago I spot-checked a ‘standard basket of goods’ (food and household items often repurchased) for myself between then and the end of 2019 (right before covid), and the average increase in price of those goods over that period of time was just about 50% overall for my personal basket of goods.


I’d be interested in seeing a price comparison of some specific items over the course of the last four years.
I’m well aware of the reporting and personal stories people have shared about rising inflation. Inflation is real. Price gouging is real. Climate change, environmental factors, livestock disease are real. I am not at all questioning that. However, I am curious as to how these factors have had little impact on my personal shopping experiences.
I live in a major east coast city. I buy 85% of my groceries from a local produce market. I rarely buy packaged foods or prepared items. Most of my groceries are local in-season fruits, veg, protein. I’ve been paying the same $5-$6 for a dozen eggs for nearly ten years. My grocery bill for the week is typically $80.
So, it’s been weird observing, from a distance, the conversation about inflation and how people are struggling to buy groceries.
I’d like to know if and / or how a small grocery store can maintain prices for over half a decade. Is it because the products are limited in their interactions with others - less inflation due to shipping it all over or compensating for rising prices of ingredients (milk, flour, eggs, etc). Is it because the metrics for “bills seem high” is based on grocery items I’m not purchasing. Is it based on geographic location or the store items are acquired? Is it because people are buying more at the store to take home rather than spend money out for dinner (because that certainly has increased). Is buying local actually a life hack for saving money?
I mean, I’m reading the chart and it’s saying prices are up 21% since '21 but I am not personally seeing that. I’m curious as to why that may be. The 22% for ‘food away from home’ though, I can absolutely confirm in my experience.
That’s called the CPI and its what the topic is about. I highly suggest you read the CPI releases. You might learn something. https://www.bls.gov/news.release/cpi.nr0.htm
CPI splits Urban vs Rural, and into economic zones like East, West, and… even by State.
https://www.bls.gov/news.release/cpi.t04.htm
If you want some help browsing these statistics, feel free to ping me.
I’m not seeing specific items in that link. I’m thinking, for example, a 3 lb chicken, a pound of 80/20 ground beef, a pound of honey crisp apples, a head of romaine lettuce, etc.
Lemme know if this is what you want: https://www.bls.gov/news.release/cpi.t02.htm
The second link is interesting. I’m in the Philadelphia area which is one of the greater percentage increases. I’d like to know what exactly is being indexed.
deleted by creator
The Walmart app provides historical receipt data if you have an associated card. A few months ago I spot-checked a ‘standard basket of goods’ (food and household items often repurchased) for myself between then and the end of 2019 (right before covid), and the average increase in price of those goods over that period of time was just about 50% overall for my personal basket of goods.
I’d be interested in learning what items increased and by how much over time.Edit: I guess this covers that question https://www.bls.gov/news.release/cpi.t07.htm#cpipress7.f.4